| Project Title/ID Number |
Advance Visualization
for Seismic Performance—4182003 |
| Start/End Dates |
10/1/03—9/30/04 |
| Project Leader |
Mike Bailey (UCSD/F) |
| Team Members |
|
F=faculty; GS=graduate student; US=undergraduate student; PD=post-doc; I=industrial
collaborator; O=other
Click on images to enlarge in a new window
1. Project Goals/Objectives:
One of the obstacles that have held back widespread integrative visualization
has been the Tower-of-Babel problem. That is, everyone communicates their
results in a different way, forcing specific specialty programs to be written
to perform visualization. Visualization innovations often get applied to
one specific problem, and are not available to the rest of the community.
We
propose establishing a Structural Visualization Information Interchange
(SVII) file format so that many different structural modeling systems
can feed a variety of visualization applications. The general flow would
look
like this:
Data-producing structural applications (purple) would make the SVII one
of the formats that they can export. Data-consuming applications, such
as visualization, would make the SVII one of the formats they can import.
This would motivate innovation in the visualization domain because any
significant effort could be amortized by use over many datasets. This would
also encourage interoperability between simulation models as they can be
displayed together and the results compared.
2.
Role of this project in supporting PEER’s mission
(vision):
3. Methodology Employed:
For the past year, we have been working with the PEER project at the
University of California Berkeley to develop and use a testbed SVII.
(A copy of the running specification is included as a separate document.)
From that effort we have learned the following:
Defining the format is
hard work. It needs to be easy to produce, easy to parse, and covers
all needs. The one we have been using has turned
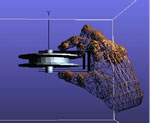
out very well for our needs. The following illustrations show two of
our applications. The first is a frame vibration model. The second
is a coupled bridge-soil model. We started with an ASCII format because:
-
It is easy to produce,
-
It is easy to parse,
-
You can look at the file and see if you got what
you think you should get, and
-
It finesses any machine-dependent binary
format problems. The ASCII format consisted of lines of text, consisting
of
a keyword
and zero
or more numerical arguments.
But, these files turned out to be huge and took quite a long time to read
in to the visualization application. So, we also defined a binary format.
The binary format consisted of the same keyword characters, but followed by
the arguments in a 32-bit binary format. This made the files somewhat smaller,
but the real improvement was in the read time, where we saw speedups of around
5X.
We did this application as a standalone C++ program because we wanted to
speed benefits of getting right into the OpenGL. We also wanted to experiment
with some of the new OpenGL features, such as shaders.
For this OpenGL version, we used GLUT (GL Utility Toolkit) to manage interaction
with the window system and GLUI (GL User Interface) for the user interface
widgets. This allowed the program to be completely portable among Windows,
Linux, UNIX, and Macintosh.
For some of our volume visualization applications, we had already added range
sliders to GLUI. A range slider can specify a range of inputs. The user can
control just the low end, just the high end, or both together. We found good
uses for these in this program.
We realized that a web-based version of this same application would be possible.
It could use Java for the program and Java3D or JOGL (Java-based OpenGL) for
the graphics. It could also use an XML-based version of the SVII as the input,
although this would exacerbate the file size and reading time problems.
We built stereographics into this program. In doing so, we realized that
this feature is a must for this type of visualization where understanding
spatial relationships is so critical.
4. Brief Description of past year’s accomplishments
(Year 6) & more detail on expected Year 7 accomplishments:
5. Other Similar Work Being Conducted Within and Outside
PEER and How This Project Differs:
6. Plans for Year 8 if project is expected to be continued:
 We propose that the NEES community establish some form of SVII to encourage
application interoperability and visualization innovation.
We propose that the NEES community establish some form of SVII to encourage
application interoperability and visualization innovation.
Both standalone
and web-based visualization applications should be considered. Note that
even standalone visualization applications can still use web-based
file delivery mechanisms just by opening a socket connection. (We use
this fir an SDSC image-delivery system.) So, both versions should use web-based
databasing.
 Some of the visualization innovations we would like to consider
are:
Some of the visualization innovations we would like to consider
are:
-
Immersiveness - there will be advantages if the program can also run
in a multi-panel projector system, or a CAVE, or a dome.
-
Volumes -
problems such as soil liquefaction are better visualized as 3D volumes.
Some of the new graphics hardware now available makes
this practical
in an interactive environment, as shown here with this underground
rock layer model.
-
Haptics - we would like to see experiments in haptic
interfaces, where researchers can feel the vibrations as well as see them.
-
Experiment
with True 3D displays. We have a Perspecta in our lab. We would like to
create a version of the Peer Visualization
program
that
runs on it.
7. Describe any actual instances where you are aware your
results have been used in industry:
8. Expected Milestones & Deliverables:


